The highlights of the Protein Turnover Atlas
Here we demonstrate the richness of the Protein Turnover Atlas in numbers. The repository covers protein turnover data on a high fraction of the human proteome in a wide range of cell models. Factors that have been shown to influence protein turnover, such as tissue type, gender and disease, are broadly represented in the cell line panel.
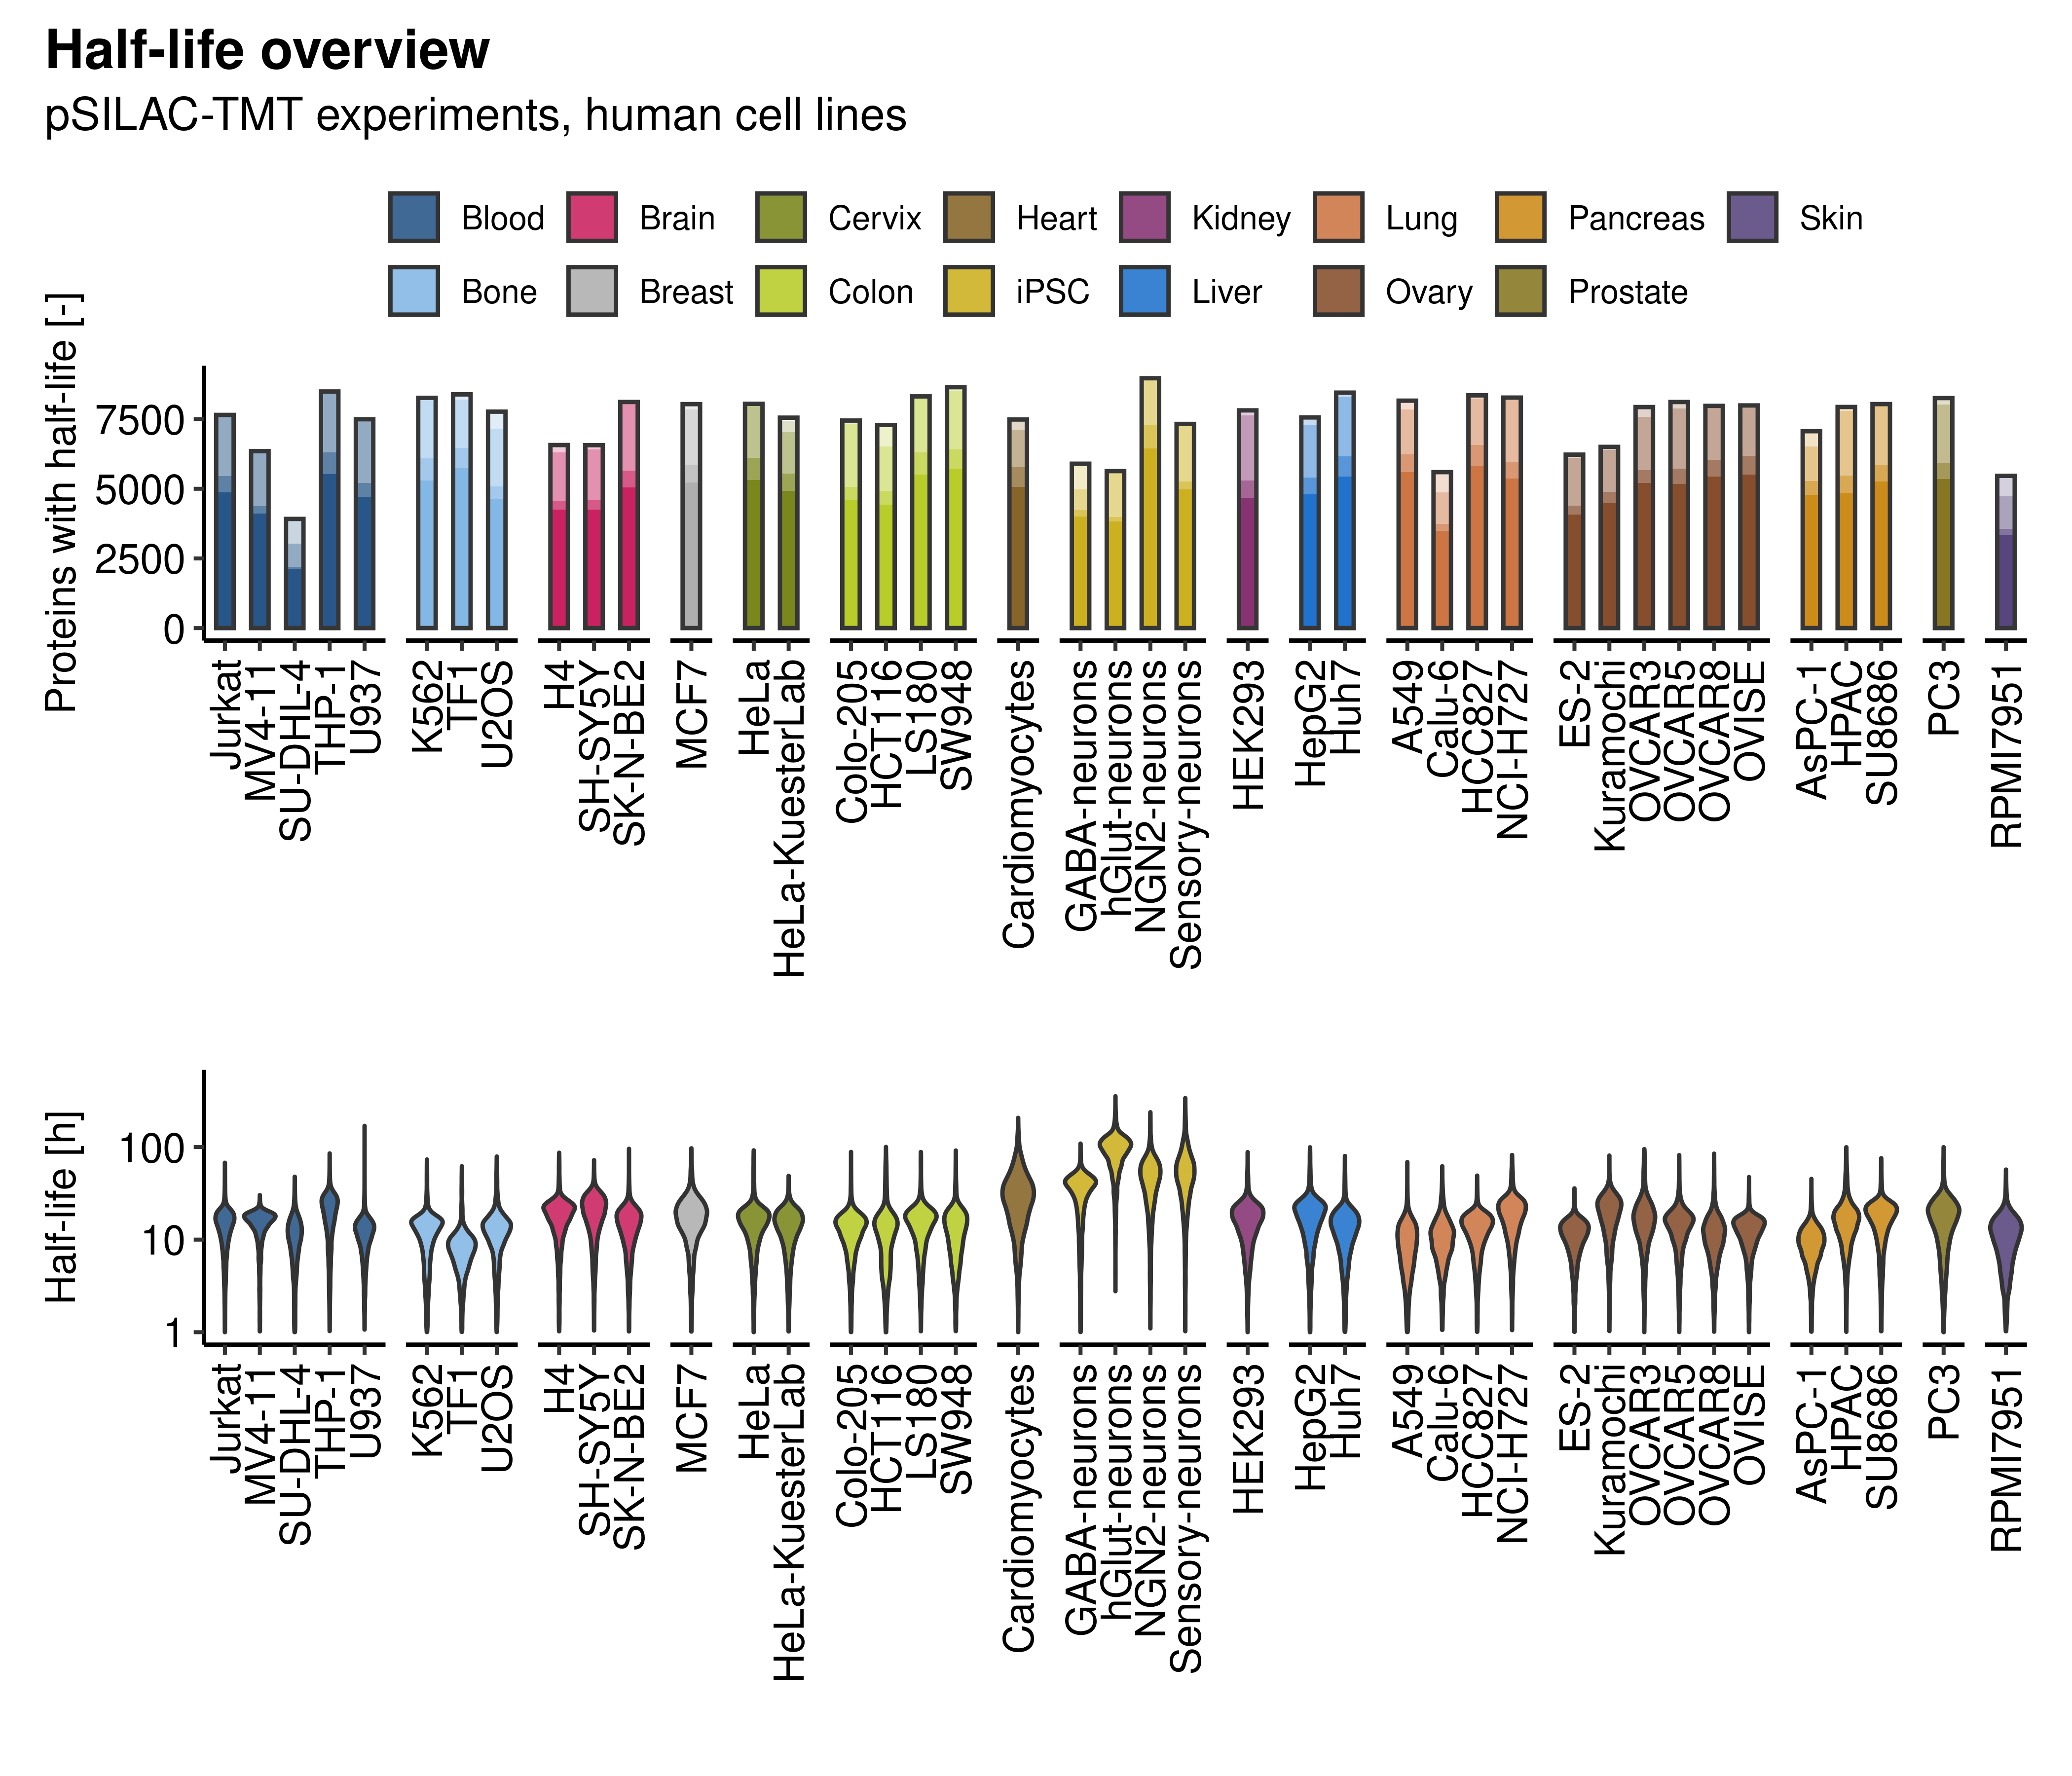
Complementarily, we show an overview of the number of proteins with available half-life data for each cell line, focusing on all human cell lines with pSILAC-TMT data. The darker the shade of the bar, the better the estimate. On average, approximately 71% of proteins quantified in a cell model have turnover rate estimates classified as very good and reliable. In addition, the respective half-life distributions are also depicted.
Half-lives of 15109 proteins based on gene name (human only)
23131 protein half-lives isoform-resolved (human only)
52 cell models from 16 tissue origins included & continuously expanding
On average 7178 protein IDs per cell line
Covering several cancer-related mutations, e.g., KRAS G12C, G12D and many more
Comprehensive reports providing overviews per protein of interest or cell line
Transparent quality control and classification of protein half-lives with 437928 class 1 curve fits (human only)
Plus 5 reprocessed external datasets complementing turnover profiles (Zecha et al., Mol Cell Proteomics 2018 & Mathieson et al., Nat Commun 2018)